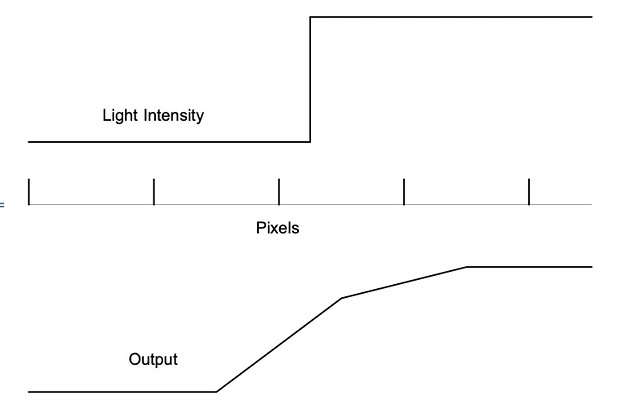
In the graph above where you show the light gathered by the wells (this is prior to shifting remember), why does a pixel that has no light hitting it record light hitting it? You are showing 4.5 pixels here, yes? And the step change in the light value occurs 1/4 of the way into the third pixel?
Why would the output from the pixels shown not be 0, 0, 0.75, 1, 1..? This is of course what your data represents if it were presented as a point plot, or a stepped line, but it is not. It is presented as a line graph - the inference being that the value of the amount of light recorded by each pixel, which you show in your diagram to have dimensionality, is the integral under the line.
It's harder to compare bar charts or point plots than it is to compare line plots. No inference intended.
Following images removed for ease of reading.
Why are you only working with one dimensional pixels?
It's a simplified model.
What are your assumptions about the colour of the light?
Monochromatic.
What are your assumptions about the way the raw data captured by the pixels behind the Bayer array?
No Bayer array.
What are your assumptions about the way that raw data from the 8 captured images is interpolated and interpreted?
I don't even know how an unshifted Bayer demosaicing works. The standard convolution has been surpassed, and I do not presume to speak for current engineering. Hence the simplified model.
Now I have no idea how the S1R/SL2 take the 8 captured RAW files and creates a single 4x resolution RAW file output, but the fact of the matter is that they do have the original Bayer arrayed data from each of the 8 files to work with, and I would assume that they actually take advantage of that data when creating the output RAW. How is Mathematica going to do a better job if it is working solely with a single file that has already had Bayer interpolation algorithms applied (and that presumably would be rather tough to reverse engineer)?
It isn't.
I'd really like to try to understand this better, so perhaps that would best be done by using a diagram. I will work on the assumption that you show the light step at 1/4 of the way across your pixel wells to perhaps indicate that the light step occurs at the half-pixel position both horizontally and vertically.
What you show below is great for color fidelity (I say that somewhere many posts ago). What I was investigating was the claim - that seems obvious, but is theoretically false - that pixel shift increases resolution.
To simplify things in the first instance, let's assume that there is also a step-change back to 0 - we can deal with the scenario where there is a step change from 0 to 1, and it stays at 1, later, if need be.
Here's the diagram showing how sensor is shifted to take the 8 images (I'm pretty sure this is correct, but it is an assumption on my part. For the first set of four captures the sensor shifts one pixel horizontally, one pixel vertically, and one pixel diagonally; then it shifts half a pixel diagonally, and repeats the pattern).
"X" indicates the quarter of the upper left pixel (red on the Bayer array) that has a light value of 1 (i.e. ignoring interpolation the value for the light hitting this pixel would be 0.25), all other parts of the sensor can be assumed to have a light value of 0.
(It's simpler to draw this with a static sensor and the pixel in question moving around, but of course what is actually going on is that "X" remains in the same position as the sensor shifts underneath it.)
Covering each color is great. I don't know how the other shifts that overlap several different color pixels are used in the image reconstruction. It is undoubtably important to increasing resolution rather than "merely" improving color.
My first (genuine) question is this - based on the calculations behind the graphs you share, what are the RGB light intensity values for the four pixels that result when the 8 shifted images are combined into a 4x resolution file (separately calculated for incident red, green, blue and white light; both for actual shifting - taking into account Bayer interpolation algorithms and the algorithms used by the S1R/SL2 when creating the 4x resolution file, and for Mathematica upsampling of just the top left plot)?
Again, I am not dealing with color. Only linear resolution. I wish I knew more about the question you ask, as it is the REAL question. I doubt we'll find anyone who actually knows the answer who is allowed to tell us. There are probably papers out there giving some algorithm. It may be very complex. It may be simple due to some fortunate trick. Maybe it's as simple as inverting the matrix of pixel values from different colored images. I have the bad habit of solving these problems from first principles rather than looking at the literature. Sometimes I find new things that way. Sometimes I miss things everyone else knows. On balance, it has served me well.
My second (facetious) question is - if Mathematica's upsampling is so good, what is the cut-off resolution where we no longer need to worry about capturing actual resolution on the sensor?
I know too much about bad interpolation techniques and the pitfalls of relying on them. Of course, Finance and Photography are different, and what is good for one may be bad for the other. This is another reason I stick to simplified models and simple interpolation to gain a better feel for what is possible.
I do of course recognise that possibly the more realistic model presented and questions raised are too complex to answer, because there are too many unknowns. But if that is the case, I would perhaps suggest that if we simplify a scenario too far, the results of that over-simplification may well turn out to have little to no appication in a real world scenario.
On the contrary, I believe that simplified models get you 90% of the way there. It's getting that extra 10% that takes years of hard work by talented engineers. We're drifting into theology here, and I don't insist that anyone share my view. I did the above for my own curiosity. If someone else finds it interesting, well and good.
Kind regards,
Gerald.


") .
.